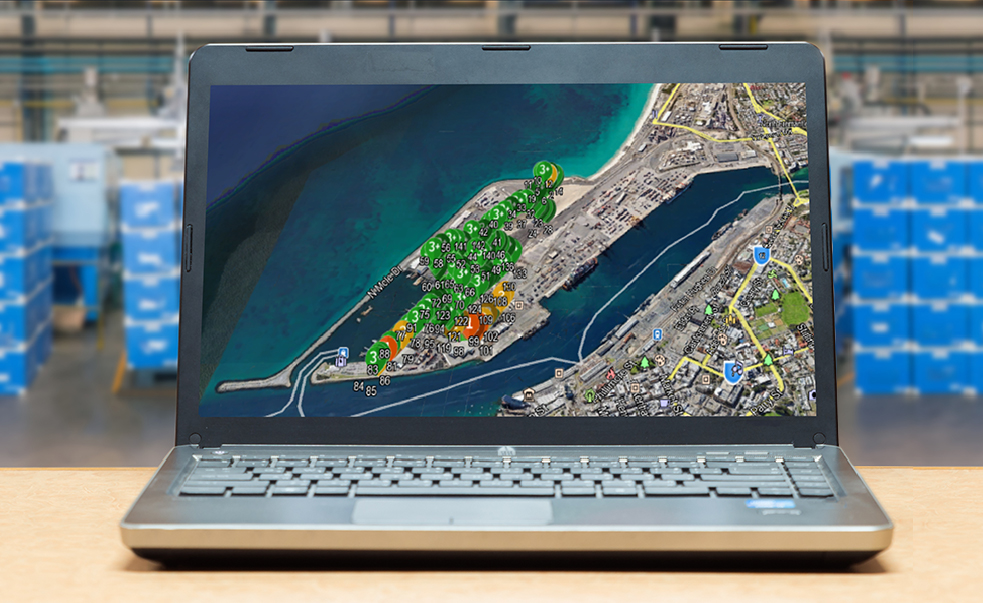
The MeshMapper is a network performance survey utility that demonstrates the level of Kinetic Mesh connection in a mesh network within specific geographic locations.
The tool produces a connectivity heat map so users can analyse, diagnose, and optimise the performance of the Kinetic Mesh network. It gives network administrators full visibility of the infrastructure and how well the placements cover the active area.
When a BreadCrumb travels through a mesh infrastructure, data is obtained from the node using a GPS device, and is combined with a Signal-to-Noise Ratio (SNR), the cost to each BreadCrumb peer, and the total cost for a live trace. The MeshMapper will then use this data to create a connectivity ‘heat map’ in a KMZ file and it will then be saved onto the BC Commander host.
The file can then be viewed in a KML viewer, such as Google Earth, and the data can be viewed for the trace path, or you can select a data placemark to look at specific information for that location.
This solution gives a visual representation of the coverage and connectivity of a specific area, giving complete visibility of any connection weaknesses in specific areas, this is beneficial for network designers and administrators. The tool automatically generates data files that can be used alongside Google Earth to show how well the network performs over a travelled route.
When the heat map is generated, it is colour coded to show the paths travelled, and to give an assessment of each path. The colours vary depending on the thresholds given to networks and applications. This can be used in roundtrip engineering to validate propagation models and to work out the Total Path Cost between the mobile device and the gateway device to the wired network.

Above is an example of two travel routes, the colours represent:
Green – Total path cost 10000 or under
Orange – Total path cost 10001 and 20000
Red – Total path cost greater than 20000
Read more here – https://rajant.com/bc-meshmapper-autonomous-operations/
